Get the briefing by email: when the forecast moves and weekly through Election Day, then how our forecast did. See one

A chart from The Ballot Nobody Finishes

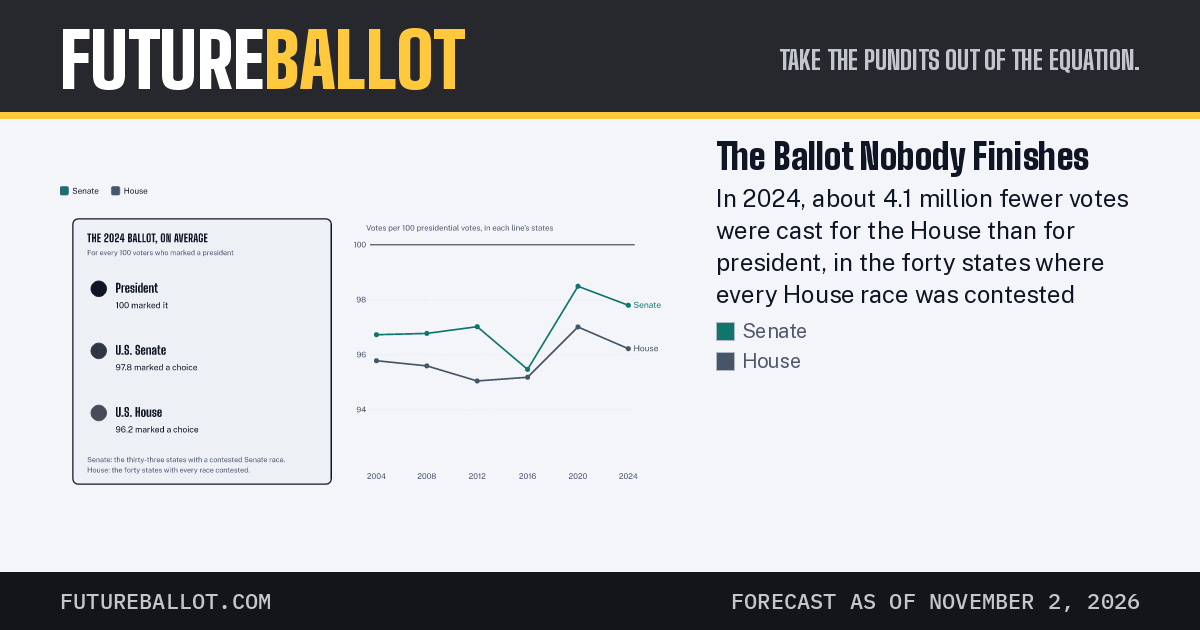
The Ballot Nobody Finishes

SenateHouseTHE 2024 BALLOT, ON AVERAGEFor every 100 voters who marked a presidentPresident100 marked itU.S. Senate97.8 marked a choiceU.S. House96.2 marked a choiceSenate: the thirty-three states with a contested Senate race.House: the forty states with every race contested.949698100Votes per 100 presidential votes, in each line's states2004 Senate: 96.7 votes per 100 presidential votes2008 Senate: 96.8 votes per 100 presidential votes2012 Senate: 97.0 votes per 100 presidential votes2016 Senate: 95.5 votes per 100 presidential votes2020 Senate: 98.5 votes per 100 presidential votes2024 Senate: 97.8 votes per 100 presidential votesSenate2004 House: 95.8 votes per 100 presidential votes2008 House: 95.6 votes per 100 presidential votes2012 House: 95.0 votes per 100 presidential votes2016 House: 95.2 votes per 100 presidential votes2020 House: 97.0 votes per 100 presidential votes2024 House: 96.2 votes per 100 presidential votesHouse200420082012201620202024

In 2024, about 4.1 million fewer votes were cast for the House than for president, in the forty states where every House race was contested

  • Senate
  • House

Forecast as of November 2, 2026. See it in context · Preview image (PNG, 1200 by 630)